Proving a Sound Geogrid Structure
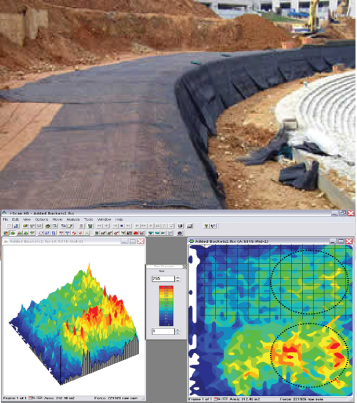 Figure 1: The top half of the pressure mapping image shows uniform sand pressure distribution of the geogrid, while the bottom shows the sand pressure distribution without the geogrid.
Challenge:
Geogrids consist of geosynthetic materials used to reinforce structures and earth materials, such as soil and rock. Therefore, it's important for civil engineers to have a clear understanding of geogrid pressure distribution for reinforcing retaining walls and sub-bases.
Solution:
Recently, one construction company used pressure mapping technology to evaluate the structural uniformity of a geogrid. A pressure mapping sensor was applied to a foam base, with a geogrid covering the top half of the sensor, and the bottom half as the control. Five pound buckets of sand were poured onto each half of the sensor, creating an approximately 10 cm (4 in.) sand cover.
In Figure 1, the top half of the pressure mapping image shows the sand distribution across a geogrid to be much more uniform than the control-half of the sensor. This evaluation reassures the benefits of geogrids, allowing civil engineers to build roads and structures where it was otherwise impossible.
Similar Applications:
- Understanding roadway wear & tear from environmental factors (freeze-thaw cycles)
- Rockfall impacts
Choose Your Next Destination! Select From the Icons Below
